Pvalue
Live at pvalue.frostworks.dev.
What it is
Pvalue is a significance calculator that runs in the browser. It tells you whether the difference between versions in an experiment is real or just noise. It has two modes:
- Paywall, for subscription paywall experiments where prices, plans and free trials change between variants.
- Generic A/B, for ordinary conversion-rate tests.
There's no sign-up, and nothing you enter leaves your browser.
How it works
Setting up a test
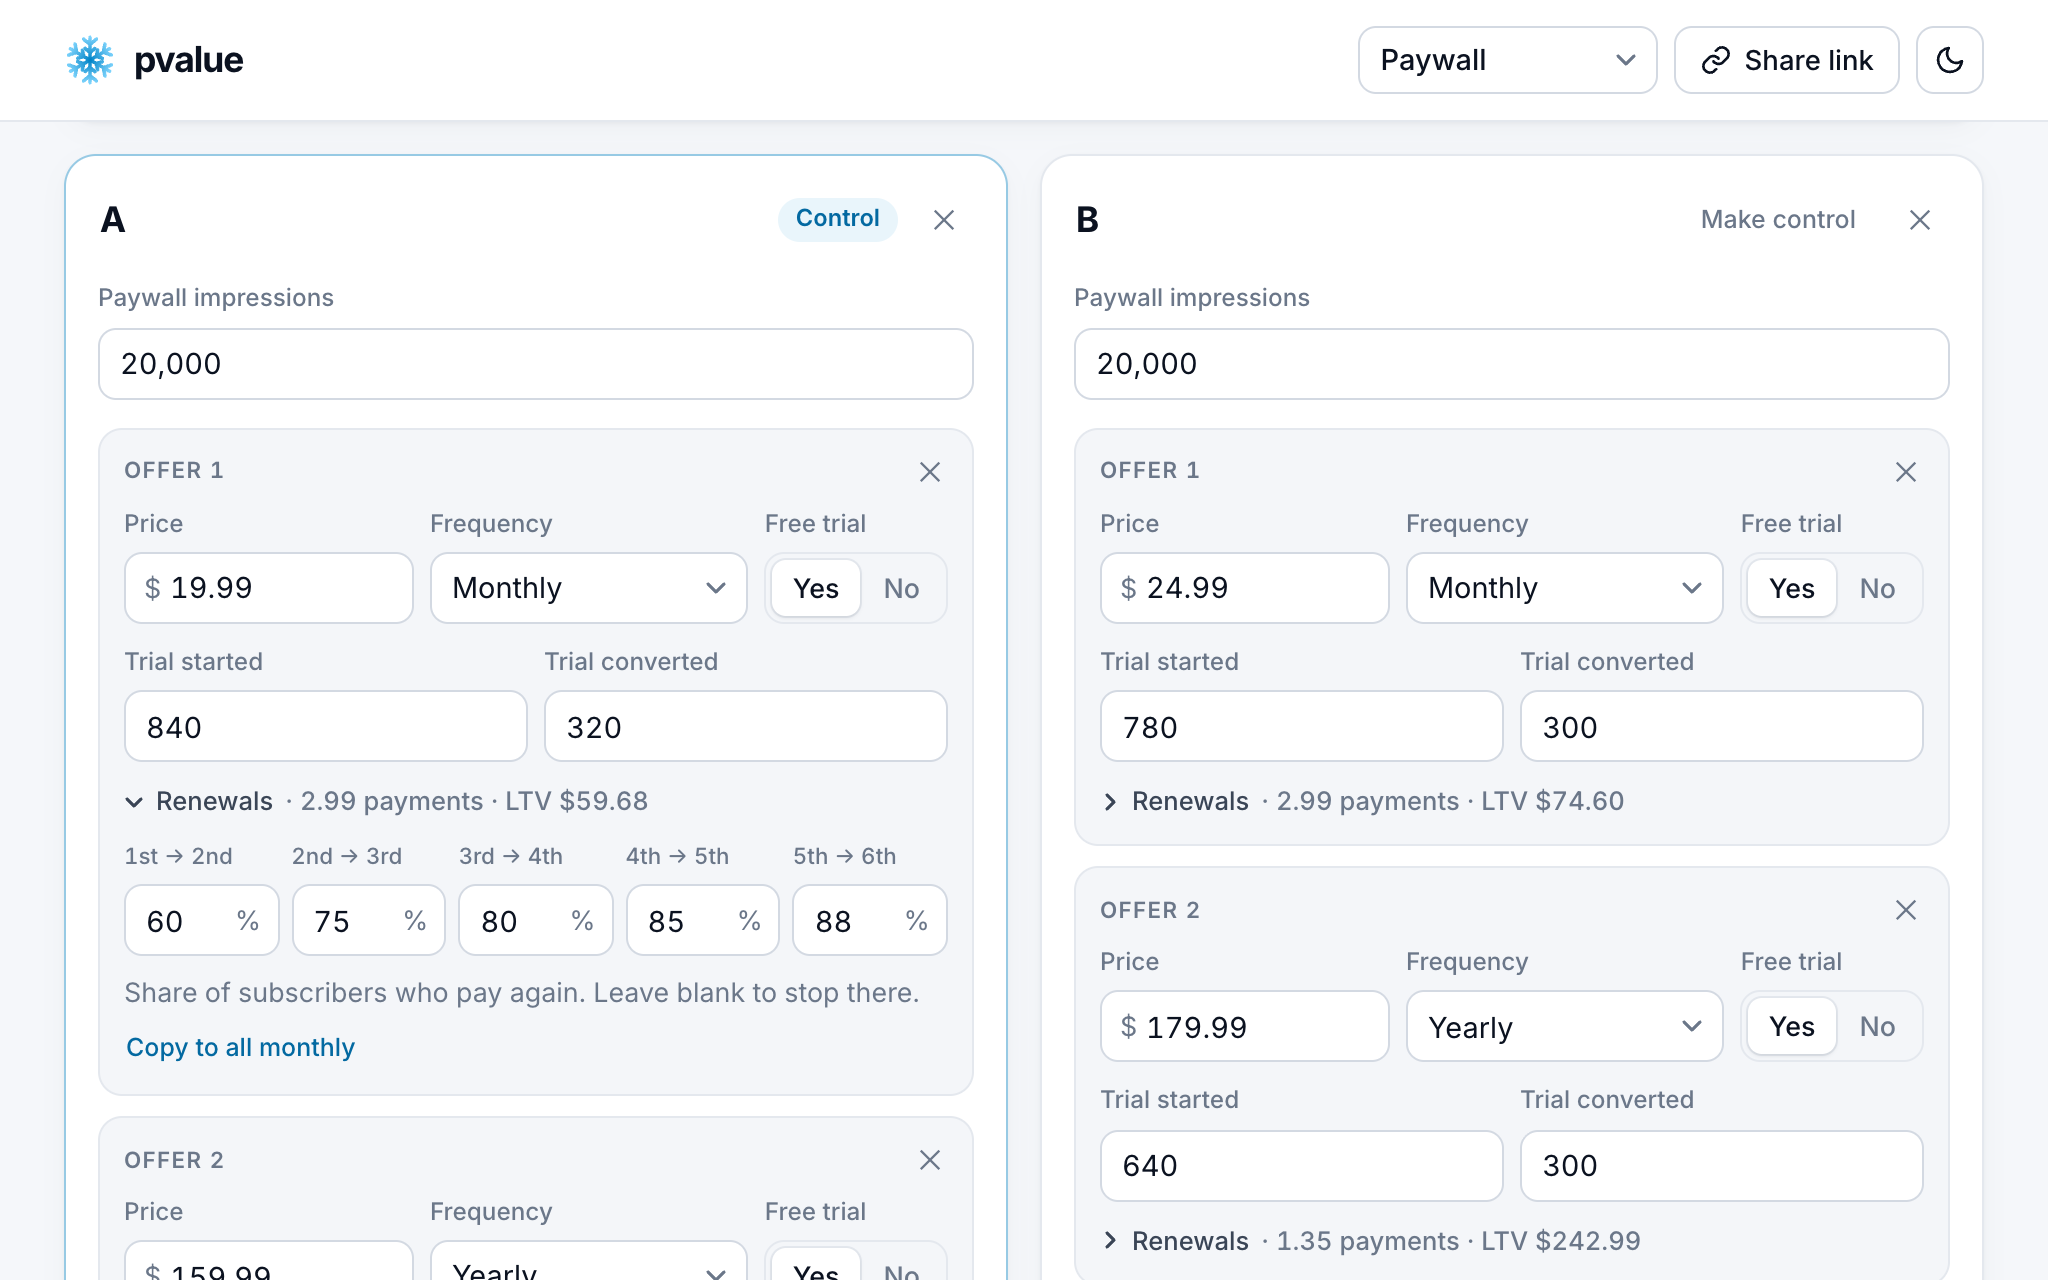
Each card is one variant, and the first is the control. For each one you enter its paywall impressions and its offers: the price, the billing period, whether there's a free trial, and the counts from RevenueCat. Adding a variant copies the previous one's offers, so you only type prices and numbers.
Renewal rates are optional. Add them and Pvalue can judge variants on projected lifetime value instead of first payments.
The verdict
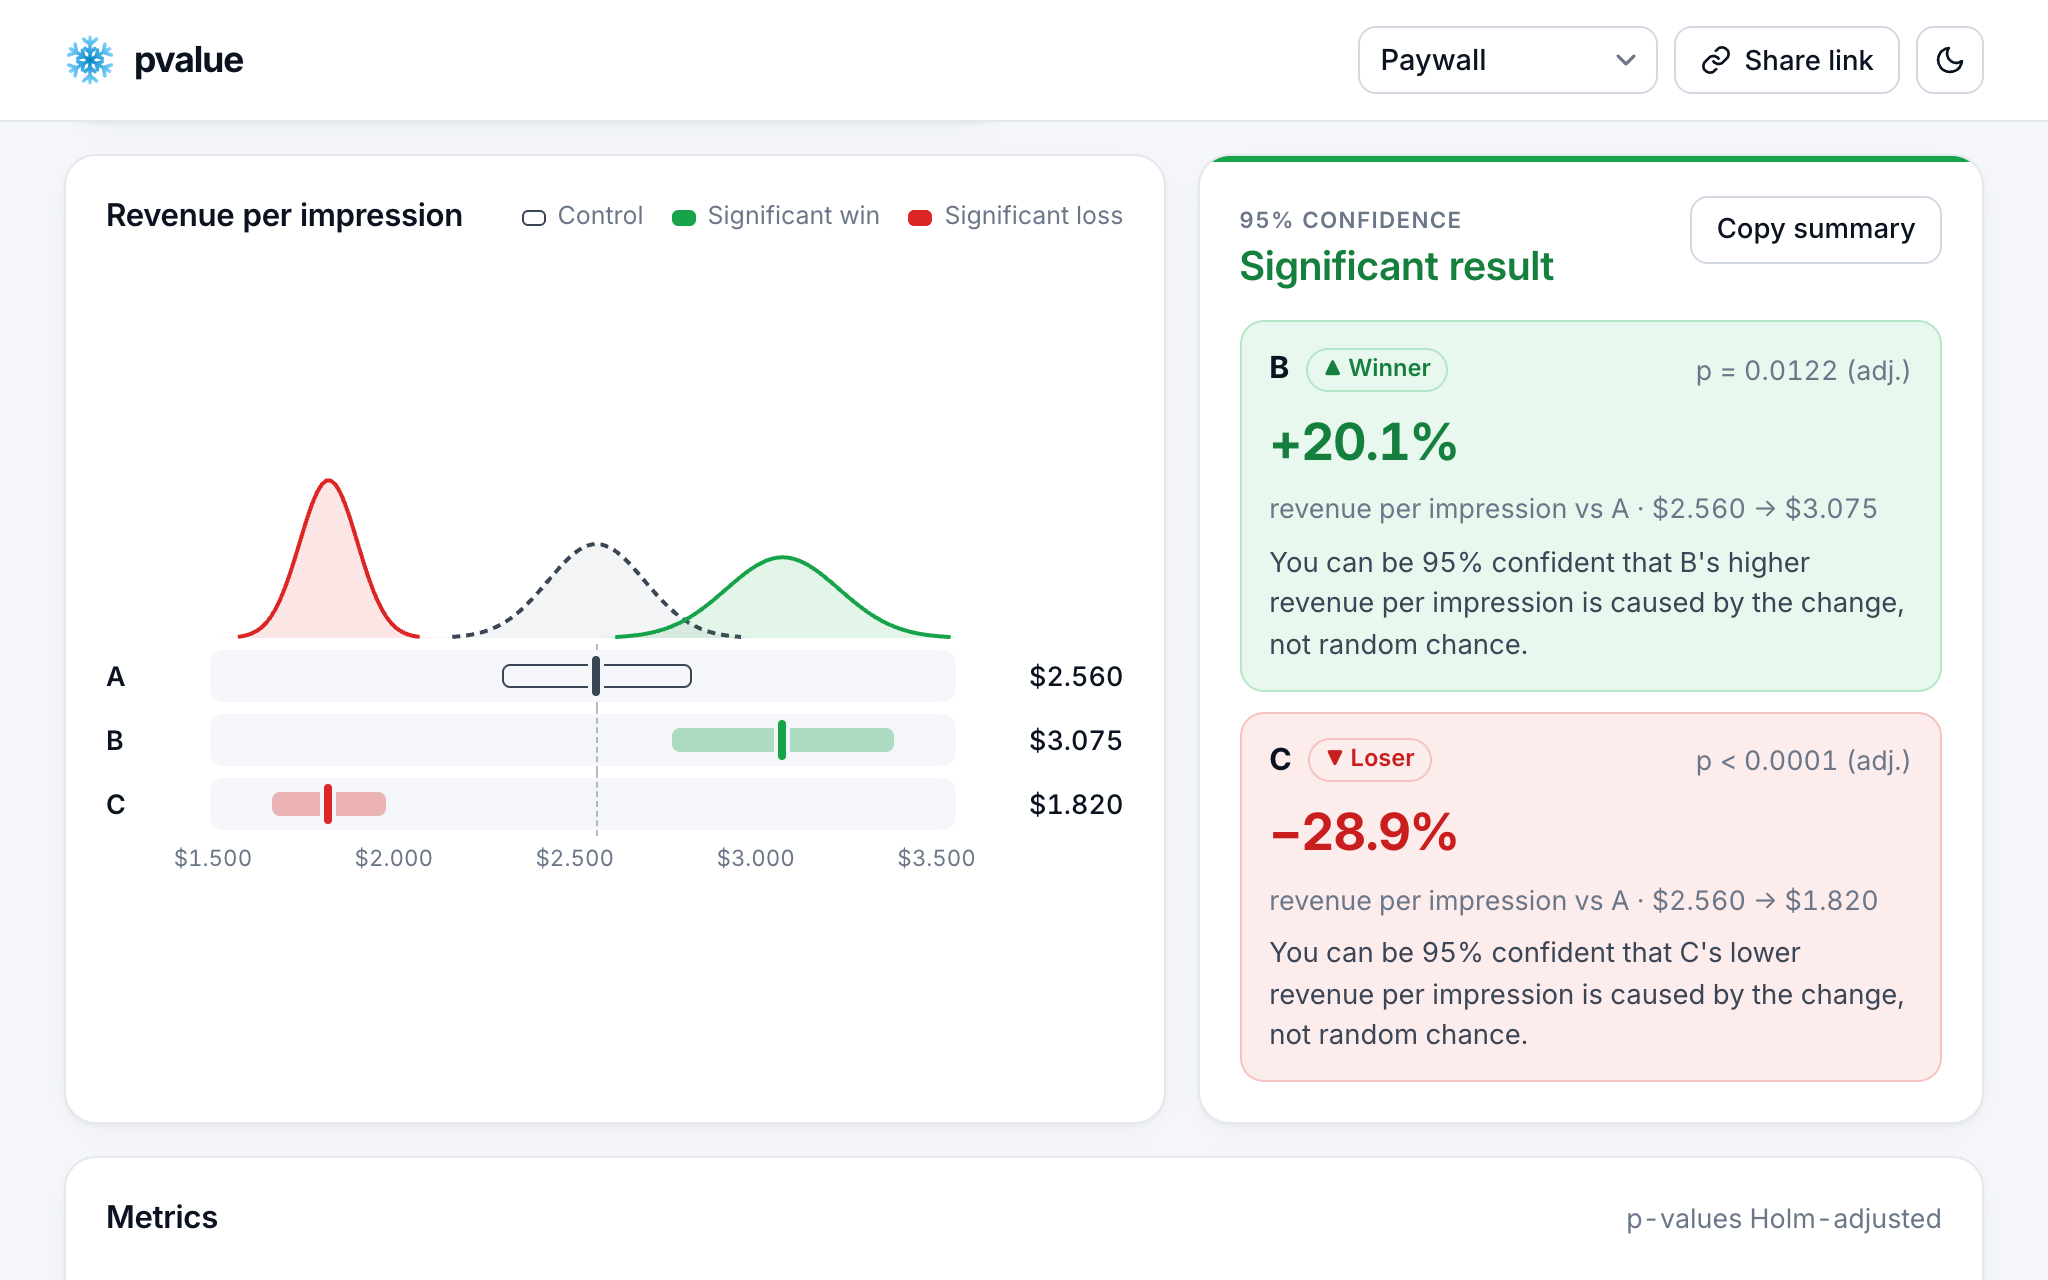
Results appear as soon as there's enough data. The chart shows each variant's revenue per impression with its likely range. The verdict calls each one a winner, a loser or not significant, with one plain sentence on what that means. Copy summary copies it as text, ready for Slack or a doc.
Why revenue moved
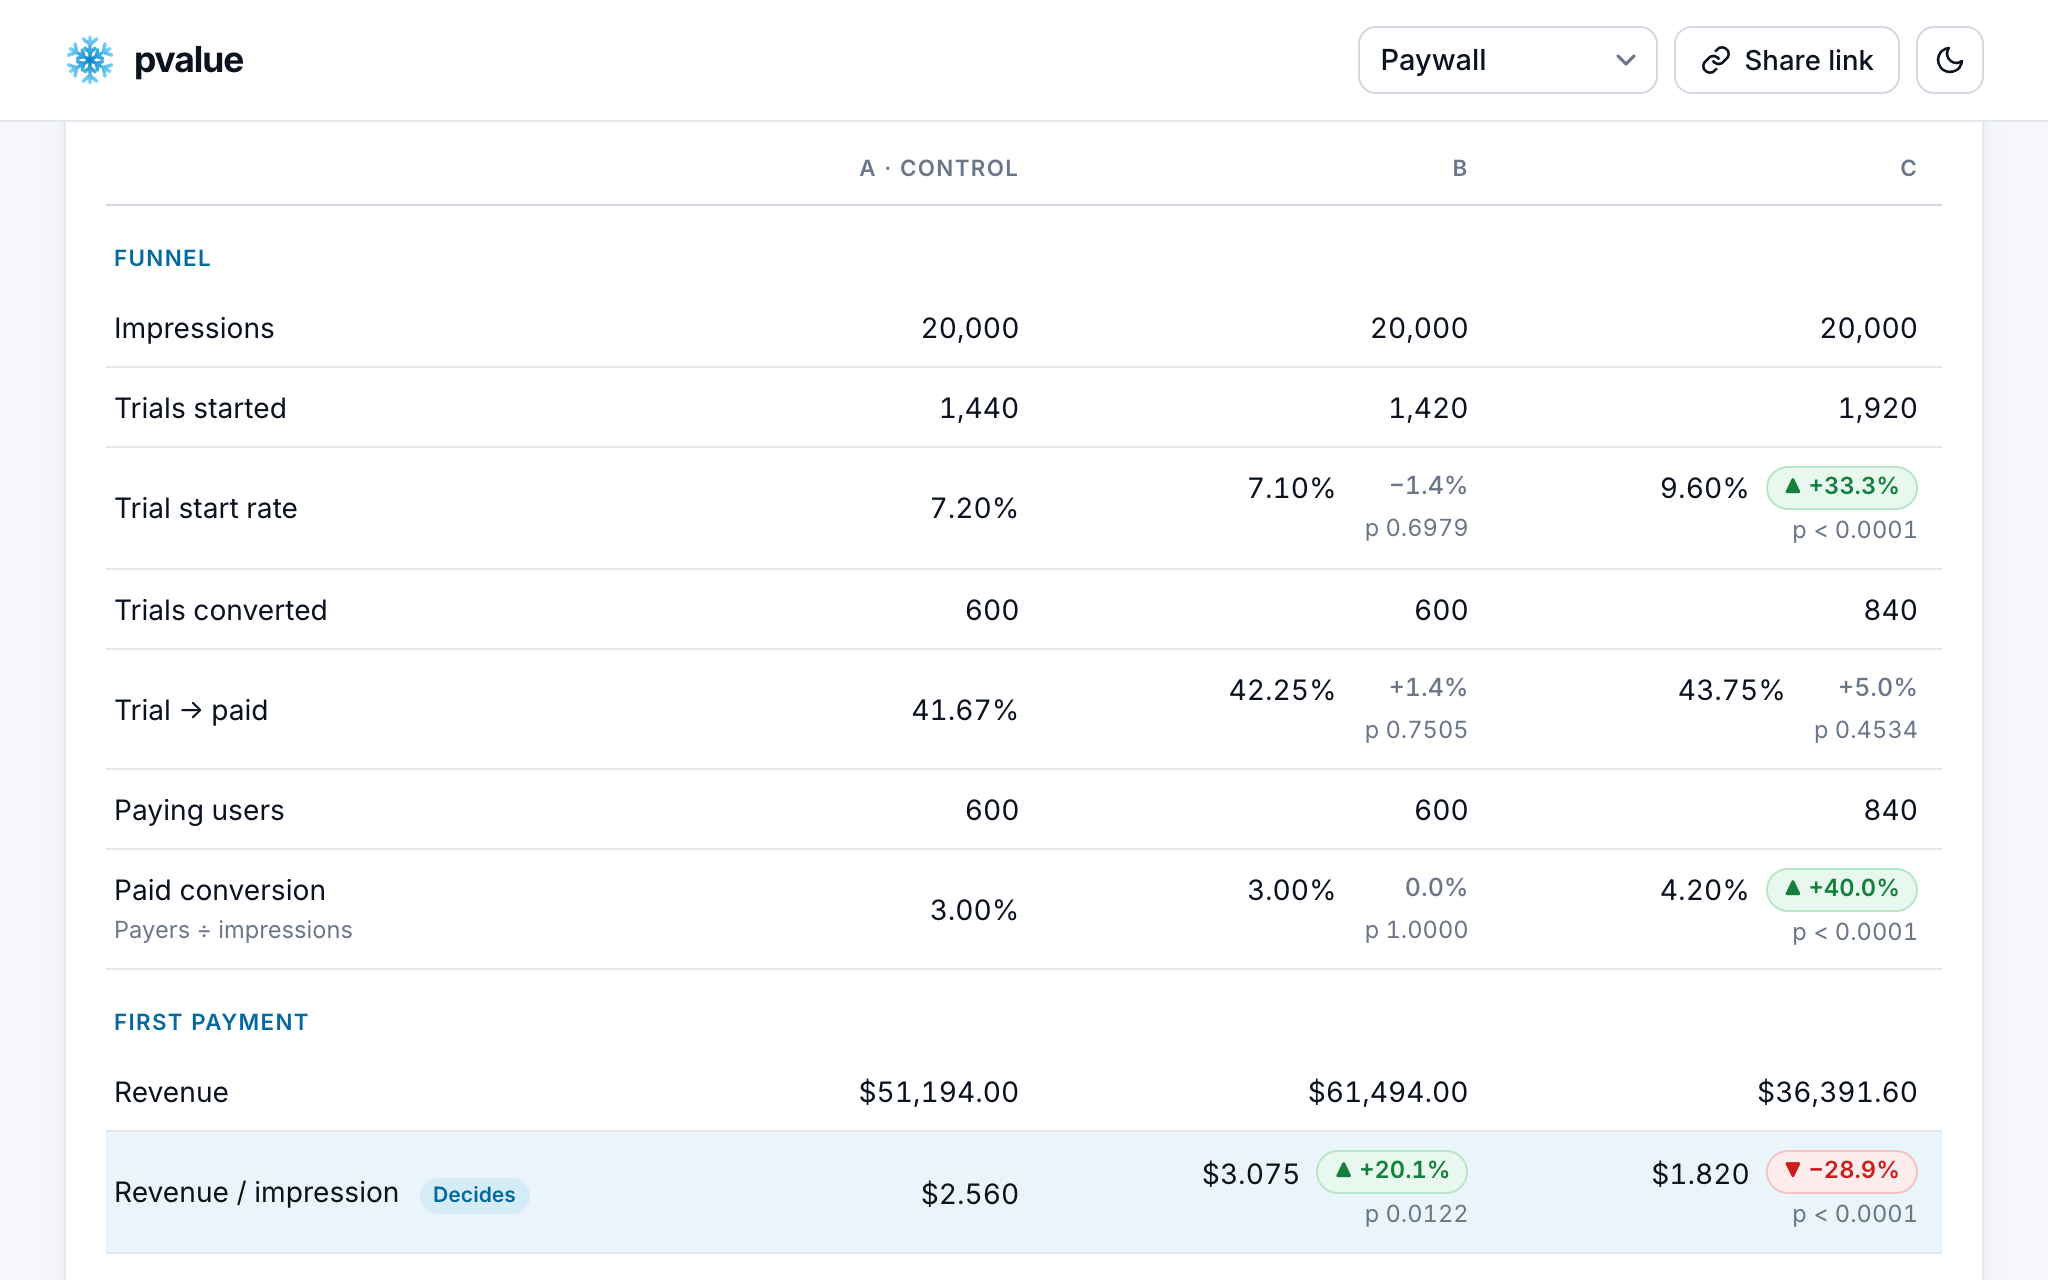
The metrics table shows every number behind the verdict, side by side. In this example C, the cheapest paywall, gets 40% more paying users and still makes 29% less per impression. A conversion-only calculator would have called C the winner.
Traffic needed
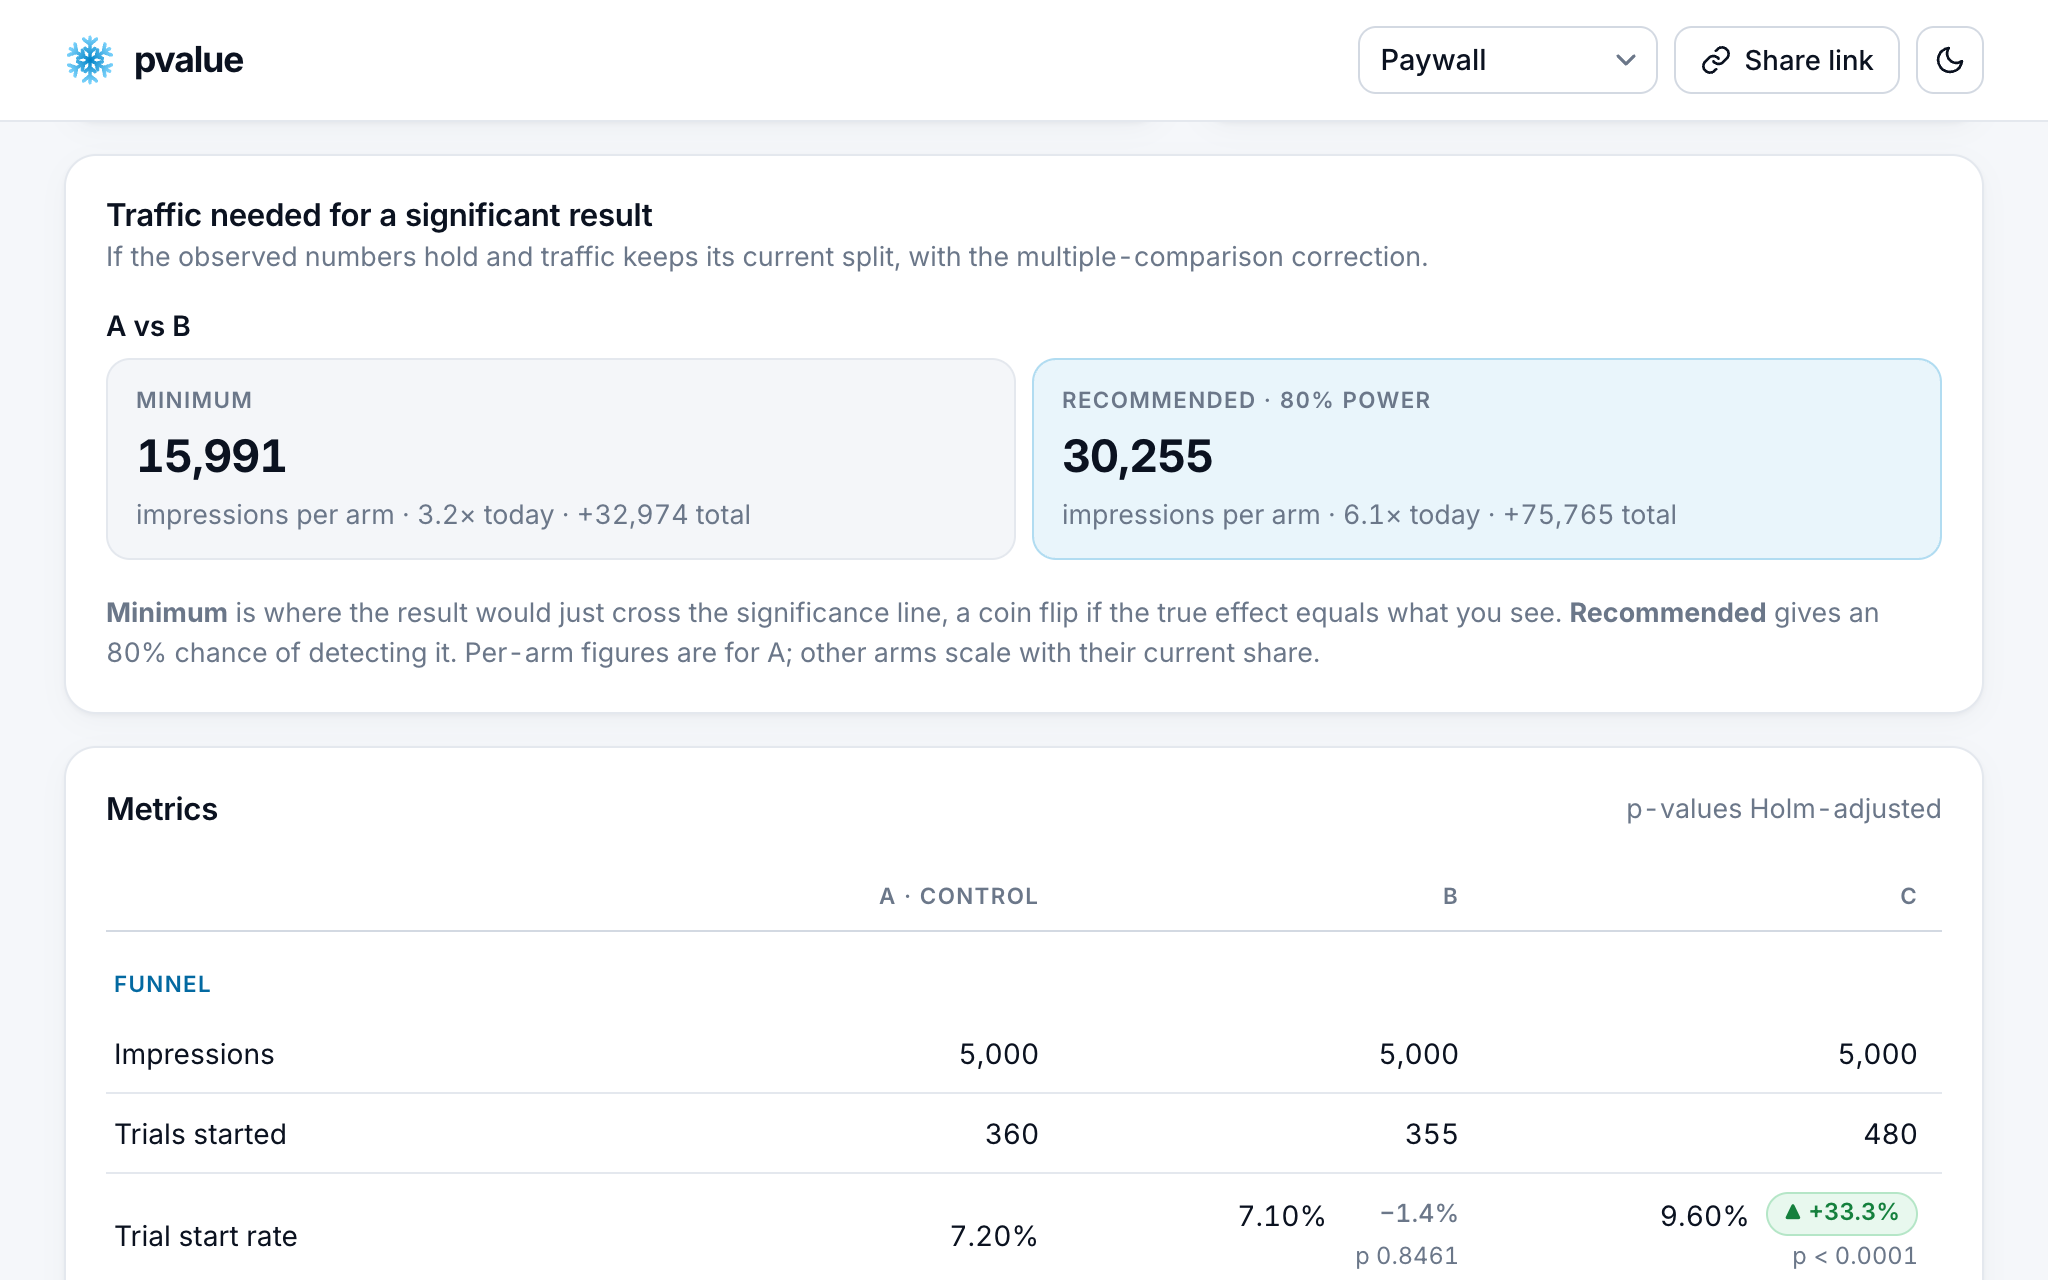
When a result is too close to call, Pvalue shows how many impressions it would take if today's rates hold, with a recommended figure that gives an 80% chance of detecting the difference.
Generic A/B mode
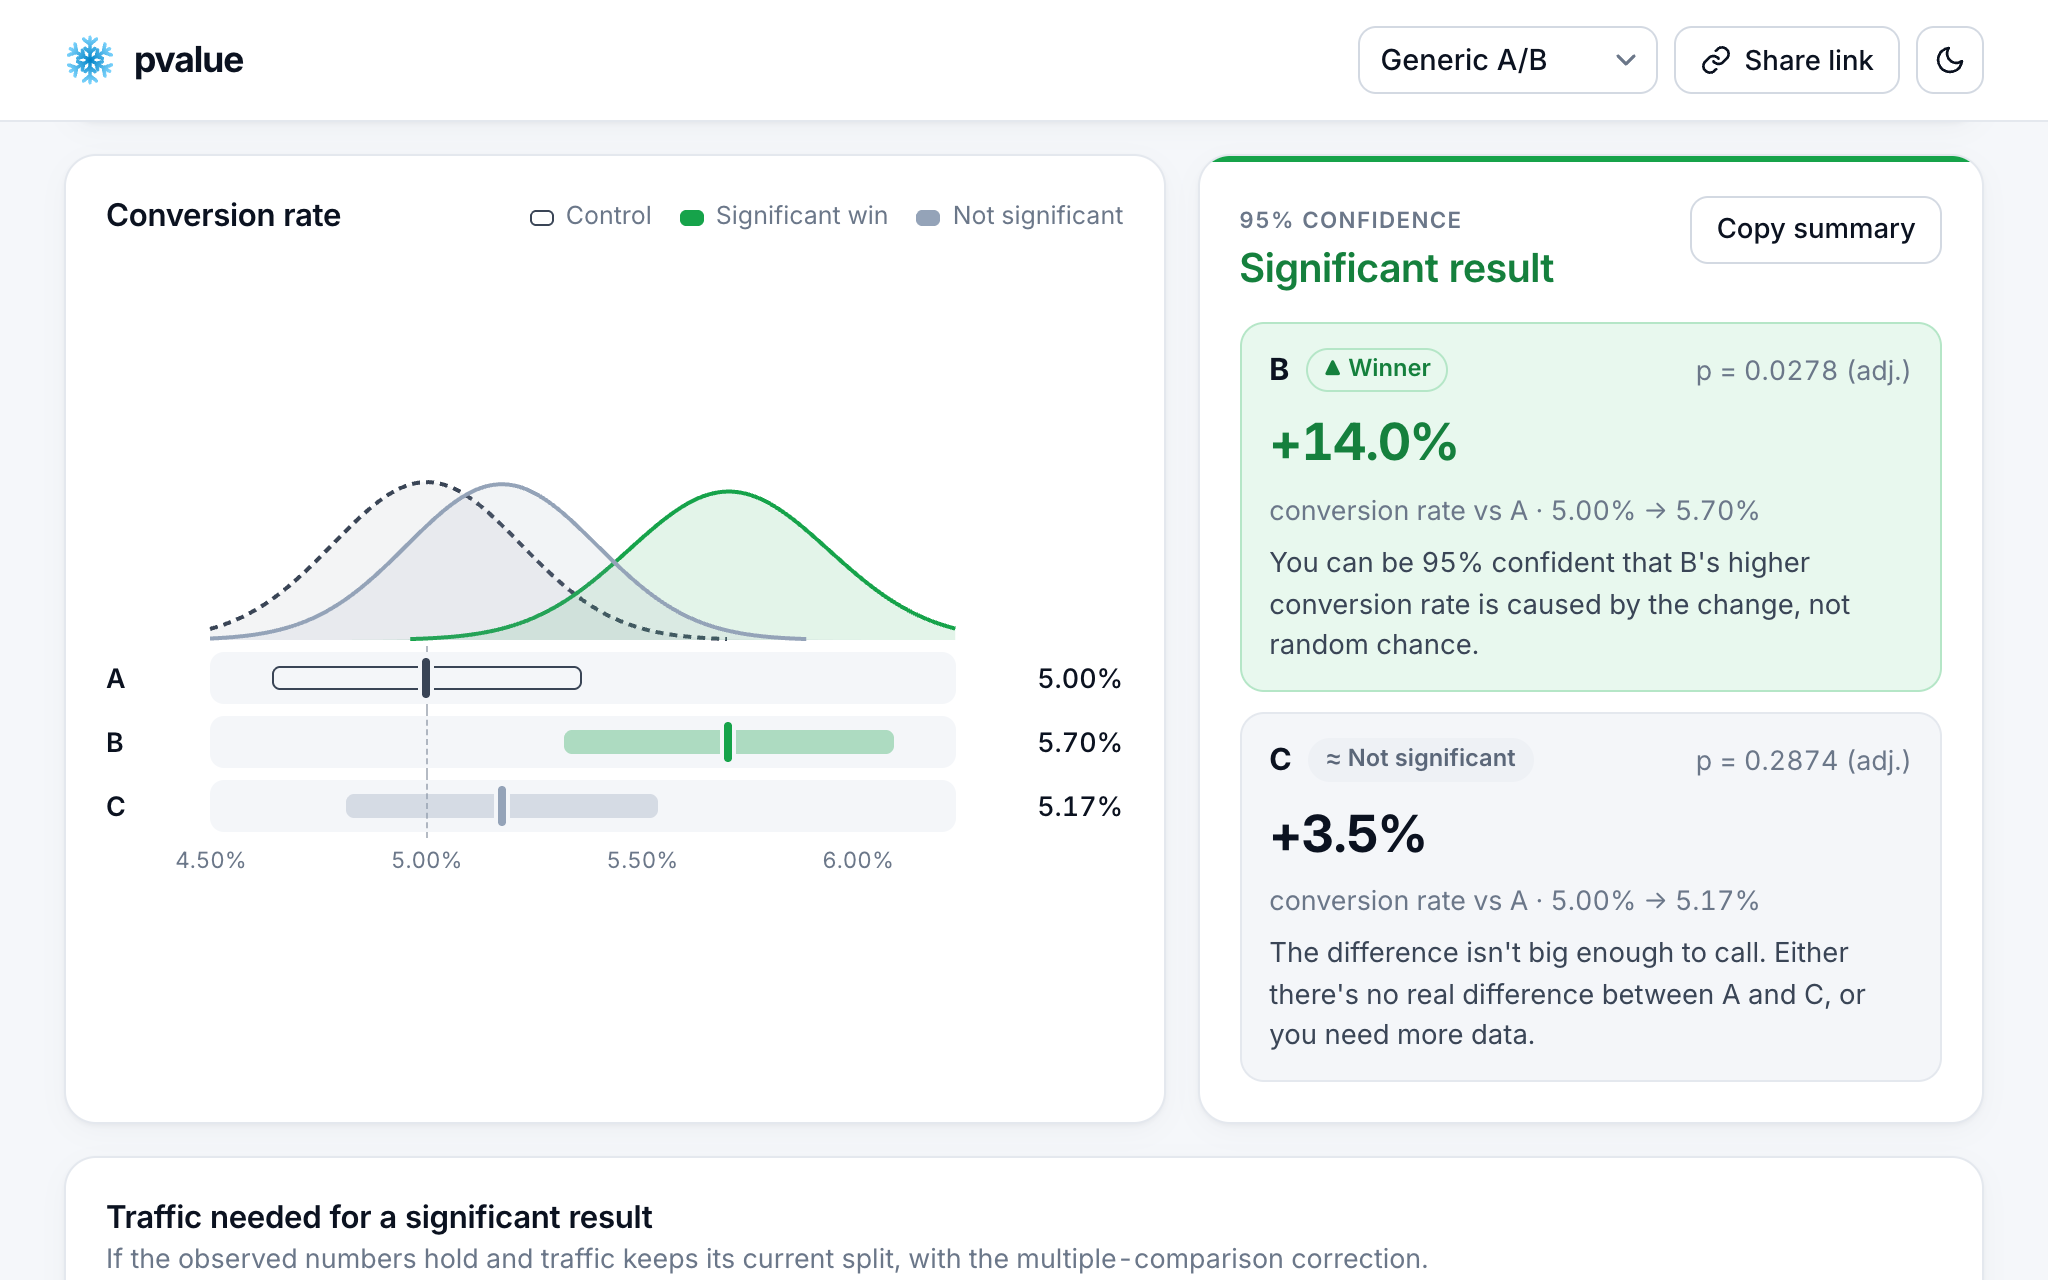
For ordinary tests, each variant is a row of visitors and conversions. You get the same chart, verdict and traffic estimate for conversion rate. It uses the same test as abtestguide.com, so the same numbers give the same answer.
And more
- Any number of variants, with a correction on by default so extra variants don't produce more false winners.
- One-sided or two-sided tests, and confidence levels from 80% to 99%.
- A warning when the traffic split looks uneven, which usually means a tracking problem.
- Share links that open the same test with every number filled in. The numbers never reach a server.
- Saved as you type, in your browser.
How it's built
Pvalue is a static Svelte and TypeScript site on Cloudflare Pages, with no backend, no accounts and no analytics. Every calculation runs in the browser.
For a paywall test, the math works like this:
- Revenue per impression:
Σ (payers × price) ÷ impressions, with people who didn't pay counted as $0. - Spread, from your totals alone:
pᵢ = payersᵢ ÷ impressions,mean = Σ pᵢ × priceᵢ,variance = Σ pᵢ × priceᵢ² − mean². - Compare with the control:
z = (mean_B − mean_A) ÷ √(var_A ÷ n_A + var_B ÷ n_B), which gives the p-value. - Call it:
p < 0.05at 95% confidence is a winner or a loser. With three or more variants, p-values are Holm–Bonferroni adjusted.
Canonical URL: https://frostworks.dev/projects/pvalue
Markdown: https://frostworks.dev/projects/pvalue/index.md
Site index: https://frostworks.dev/llms.txt
Everything in one file: https://frostworks.dev/llms-full.txt
[← Projects](https://frostworks.dev/projects.md) # Pvalue Live at [pvalue.frostworks.dev](https://pvalue.frostworks.dev). [Explainer video](https://frostworks.dev/images/projects/pvalue/video.mp4) ## What it is Pvalue is a significance calculator that runs in the browser. It tells you whether the difference between versions in an experiment is real or just noise. It has two modes: - **Paywall,** for subscription paywall experiments where prices, plans and free trials change between variants. - **Generic A/B,** for ordinary conversion-rate tests. There's no sign-up, and nothing you enter leaves your browser. ## How it works ### Setting up a test Each card is one variant, and the first is the control. For each one you enter its paywall impressions and its offers: the price, the billing period, whether there's a free trial, and the counts from RevenueCat. Adding a variant copies the previous one's offers, so you only type prices and numbers. Renewal rates are optional. Add them and Pvalue can judge variants on projected lifetime value instead of first payments.  ### The verdict Results appear as soon as there's enough data. The chart shows each variant's revenue per impression with its likely range. The verdict calls each one a winner, a loser or not significant, with one plain sentence on what that means. **Copy summary** copies it as text, ready for Slack or a doc.  ### Why revenue moved The metrics table shows every number behind the verdict, side by side. In this example C, the cheapest paywall, gets 40% more paying users and still makes 29% less per impression. A conversion-only calculator would have called C the winner.  ### Traffic needed When a result is too close to call, Pvalue shows how many impressions it would take if today's rates hold, with a recommended figure that gives an 80% chance of detecting the difference.  ### Generic A/B mode For ordinary tests, each variant is a row of visitors and conversions. You get the same chart, verdict and traffic estimate for conversion rate. It uses the same test as abtestguide.com, so the same numbers give the same answer.  ### And more - **Any number of variants,** with a correction on by default so extra variants don't produce more false winners. - **One-sided or two-sided tests,** and confidence levels from 80% to 99%. - **A warning** when the traffic split looks uneven, which usually means a tracking problem. - **Share links** that open the same test with every number filled in. The numbers never reach a server. - **Saved as you type,** in your browser. ## How it's built Pvalue is a static Svelte and TypeScript site on Cloudflare Pages, with no backend, no accounts and no analytics. Every calculation runs in the browser. For a paywall test, the math works like this: 1. **Revenue per impression:** `Σ (payers × price) ÷ impressions`, with people who didn't pay counted as $0. 2. **Spread, from your totals alone:** `pᵢ = payersᵢ ÷ impressions`, `mean = Σ pᵢ × priceᵢ`, `variance = Σ pᵢ × priceᵢ² − mean²`. 3. **Compare with the control:** `z = (mean_B − mean_A) ÷ √(var_A ÷ n_A + var_B ÷ n_B)`, which gives the p-value. 4. **Call it:** `p < 0.05` at 95% confidence is a winner or a loser. With three or more variants, p-values are Holm–Bonferroni adjusted.
